Abstract
Objectives:
To investigate the impact of a COVID-19 mandated lockdown on the type and frequency of dental services accessed at an undergraduate dental clinic in southwestern Ontario.
Methods:
We retrieved anonymized sociodemographic (n = 4791) and billing data (n = 11616) of patients for 2 periods of 199 days, before (T1) and after (T2) lockdown. We applied descriptive statistics and used Student’s t test to compare the type and frequency of dental services provided between the 2 periods. We mapped forward sortation area (FSA) codes of each patient.
Results:
Of the 4791 patients seen collectively in T1 and T2, most (67%) sought care before the lockdown. In both periods, most patients were ≥ 60 years of age (51.8%), female (33.9%) and residing in an urban area (88.6%). Compared with T1, there was a significant increase in middle-aged adults (p = 0.002) and significantly fewer patients earning over CAD 100 000 (p = 0.021) in T2. A total of 11616 billable procedures were carried out during T1 and T2: in T1, most procedures were preventative, whereas in T2, most were related to urgent care. Significantly fewer males than females sought urgent care, regardless of time. Finally, mapping showed a decrease in patients from Toronto, central and northern Ontario and clustering of patients in southwestern Ontario.
Conclusions:
We noted an overall reduction in billed services following the COVID-19 lockdown. The decrease in both billed services and patients seen during T2 demonstrates the impact of COVID-19 on access to timely and definitive dental care during the first 2 years of the pandemic.
On 11 March 2020, the World Health Organization classified COVID-19 as a pandemic.1 As of 19 August 2022, the number of cases in Canada had reached 4 135 607, with Ontario reporting the highest count among all 8 jurisdictions at 1 392 435 cases.2 The community spread of a virus can be measured by the rate of positive tests: as of June 2022, 64 092 283 tests had been performed with 12.4% of them positive.2
Given the high infection rates of the virus, on 20 March 2020, the Royal College of Dental Surgeons of Ontario (RCDSO) strongly recommended the suspension of all non-essential and elective dental services.3 Recall examinations, routine dental cleanings, extraction of asymptomatic teeth, restorative dentistry, including treatment of asymptomatic carious lesions, and cosmetic dentistry constituted non-essential care.4 Furthermore, because of the presumed airborne transmission of the virus,5 the Centers for Disease Control and Prevention (CDC) in the United States strongly recommended delaying dental procedures involving the use of aerosols, such as those using high-speed handpieces, air/water syringes and ultrasonic scalers.6
The imposition of new guidelines had consequences for the frequency of services provided during the pandemic across the health care sector. Decreases were seen in hospital admissions, diagnostics services and therapeutics.7 One Canadian study8 reported a 17% decrease in tooth extractions, a 17% decrease in silver diamine fluoride application and a > 80% reduction in endodontic and restorative treatments, compared with a period before the pandemic (2019). Visits to community and hospital-based dental clinics also decreased.9
One area affected by the restrictions on the use of aerosol-generating procedures (AGPs) was endodontics. Without high-speed handpieces to carry out traditional endodontic treatments, practitioners turned to non-AGPs and pharmacologic intervention to manage endodontic emergencies.10 In some cases, patients found palliation insufficient to manage their pain and opted for extraction.10 Other adverse effects of delayed dental treatments included tooth fracture, lost provisional restorations and recurring infections.10
Moreover, the pandemic had adverse effects on dental care providers. Dental professionals were initially thought to be at higher risk of contracting COVID-19.11 A study looking at dental practitioners in 30 countries found that 87% reported fears regarding contracting COVID from either a patient or co-worker.12 Among these dentists, 2/3 wanted to close their practice until the number of infected individuals in their region declined.12 Furthermore, a study of 10 117 nurses in British Columbia revealed a 10–15% increase in anxiety and depression among them at the start of the pandemic.13
Dentists were quick to adapt their provision of dental treatment by turning to teledentistry. The use of telephone triage, clinic questionnaires and body temperature measurements has been highlighted by some authors and encouraged by the CDC.6 Furthermore, remote consultations using messaging services (e.g., WhatsApp; Meta Platforms, Menlo Park, Calif., USA) have shown promise for monitoring patient conditions after oral surgery.14 A 2021 cross-sectional study found 49.3% of dentists reporting use of teledentistry15; 36% of dentists cited the pandemic as the reason for starting to use teledentistry for patient triage, consultations and education.15 This alternative means for evaluating patients post-operatively allowed the limiting of in-person clinical procedures for urgent cases only.
Finally, abundant reports describe various populations who experience barriers to access to oral health services. These include low socioeconomic groups, people living with HIV,16 senior adults,17 those with low literacy18 and the uninsured.19 It is noteworthy that populations who experience barriers are the same ones who are most vulnerable to contracting COVID-19.20
Therefore, we aimed to investigate the impact of a COVID-19 mandated lockdown on patients attending the undergraduate Schulich Dental School Clinic in southwestern Ontario by exploring the following factors before and after lockdown:
- Sociodemographic differences – specifically age, sex, location of residence, payment type and average household income
- Associations between patients’ sociodemographic characteristics and the provision of urgent dental care
- How the number of dental procedures (categorized into 8 disciplines) changed
- The geographic distribution of patients visiting the dental clinic to evaluate the influence of transportation and geographic radius on access to care
Methods and materials
For this retrospective study, we examined the electronic dental records of 4791 patients seen in the main clinic (adults) at the Schulich School of Dentistry. For this study, the patient population of a dental school clinic is of special interest because this group is typically overrepresented by those who experience many barriers to care, including cost.21
The records included demographic data, medical history, dental history, clinical examination results, radiographs, appointment records and a list of procedure codes billed to the patient and their associated date. Finally, geographic information was obtained by collecting the first 3 digits of a patient’s postal code — referred to as forward sortation area (FSA) codes.
Inclusion/Exclusion Criteria
Our study sample included all patients ≥ 19 years who meet the clinic’s eligibility criteria. For this study, we chose a time when the undergraduate clinic was operating before government-mandated lockdowns (T1) and a time when the clinic was operating after the lockdowns (T2). Comparisons between T1 and T2 were then made to see the effect of the lockdown on variables of interest.
In accordance with ministry of health guidelines, private practice dental clinics across Ontario were closed from 17 March to 15 June 2020. Therefore, we defined T2 as all dates from 15 June to 31 December 2020 (inclusive). To set T1 at the same length (199 days) and during the same season as T2, we defined T1 as 15 June to 31 December 2019 (inclusive).
Data Collection and Variable Construction
A single Excel file containing data from both T1 and T2 was generated (Microsoft, Redmond, Wash., USA) A list of all appointments completed, along with the date, was retrieved. Procedures were diagnostic, restorative, prosthodontic, emergency, oral surgery, preventative and endodontic in nature. A list of billing codes was extracted to compare the types of procedures performed in T1 and T2. Along with each appointment entry, we included the patient’s age, sex and FSA code. There was no identification of patients who came during both T1 and T2 or patients who came multiple times in a period. This design has been adopted in multiple current research studies investigating the impact of COVID-19 on patients.22-26
Data Organization
The procedure codes for each appointment were grouped into 9 undergraduate “clinic types” to differentiate treatments: 1. Complete exam, including diagnosis and treatment planning; 2. Restorative anterior, relating to direct anterior composite restorations; 3. Restorative posterior, relating to direct posterior composite restorations; 4. Prosthodontics, including both fixed and removeable appliances; 5. Emergency, relating to incision and drainage and emergency examinations; 6. Oral surgery, including simple and complicated extractions; 7. Preventative procedures, including scaling, debridement and prophylaxis; 8. Endodontics, including pulpotomy, pulpectomies and non-surgical root canal treatments; and 9. Miscellaneous.
Demographic data (age and sex) included 3 possibilities for sex (male, female and unstated) and 3 categories for age (18–29, 30–60 and > 60 years).
Data Analysis
We compared the number of patients seen and the number of procedure codes billed between T1 and T2. Specific data on the number of procedure codes billed for each clinic type were also analyzed. We divided dental procedures into 2 categories: urgent (emergency, endodontic and oral surgery procedures) and non-urgent (all others). The basis for including endodontic and oral surgery procedures in a single category called “urgent care” is supported by literature showcasing the prevalence of infection- and pain-related pathosis requiring root canal treatment or extractions. A study by Shqair and colleagues26 found that 79% of emergency visits were related to caries, with endodontic treatment the most frequent treatment of choice. Furthermore, a 4-year study observing 5333 patients attending an emergency department for dental pain found that, among patients who had a prior visit to the department, extraction was the most common treatment.27
Univariate analyses were calculated as frequencies and percentages for all variables. Bivariate analyses, using Χ2 tests and ANOVA, were conducted to determine the association between exposure variables (age category, sex, average household income, history of dental attendance and history of chronic medical conditions) and the outcome variable (dental clinic attendance during T1 and T2). Statistical significance was set at p < 0.05. We used simple bivariate analysis and did not account for any confounders. We used only full/complete billing records for T1 and T2. Hence, we did not incur the problem of missing data in this investigation.
Finally, the geographic distribution of patients was analyzed using FSA codes. First, the FSA codes were used to designate whether a patient was residing in a rural or urban area. As per the Government of Canada’s guidelines, the 2nd character in the FSA code denotes the area as urban or rural. A 0 indicates a wide-range rural and all other digits denote the region as urban. The FSA codes were also used to assign an average household income to each patient based on data from the 2016 Census from Statistics Canada28. Tables and figures were generated to present the differences in this variable among patients between T1 and T2. Finally, maps were created on ArcGIS software (v. 10.6.1; ESRI, Redlands, Calif., USA) to show a visual representation of patients’ distribution between T1 and T2.
Ethics approval
This study was approved by Western University’s Human Subjects Ethics Review Board (HSERB). The HSERB is registered with the US Department of Health & Human Services under Institutional Review Board registration number IRB 00000940.
Results
The first objective of this study was to investigate differences among patients — specifically with respect to age, sex, location of residence, payment type and average household income — between T1 and T2. Table 1 provides a summary of the sociodemographic characteristics of all patients seen at the Schulich dental clinic during these pre- and post-lockdown periods. Overall, 4791 patients sought care in the main dental clinic in both time periods, with the majority (3209, 67.0%) seeking care before the lockdown (T1). The mean age during T1 was 59.3 years, while in T2 it was 57.1 years. In both T1 and T2, most patients lived in urban areas (89% and 90%, respectively) and were not enrolled in government subsidy programs (97.8% and 97%). Significantly more 30–60-year-old patients attended the clinic during T2. Significantly, fewer patients earning over CAD 100 000 visited during T2 compared with T1 (p = 0.021)
|
Variable |
Patients, no. (%) |
|||
|---|---|---|---|---|
|
T1 (n = 3209) |
T2 (n = 1582) |
Total (n = 4791) |
Χ2 (p) |
|
|
Note: Bold face p values indicate statistically significant differences. |
||||
| Age category | ||||
| 18–29 years | 373 (11.6) | 162 (10.2) | 535 (11.2) | 12.02 |
| 30–60 years | 1133 (35.3) | 639 (40.4) | 1722 (36.0) | (0.002) |
| > 60 years | 1703 (53.1) | 781 (49.4) | 2484 (51.8) | |
| Gender | ||||
| Female | 1277 (39.8) | 622 (39.2) | 1899 (39.6) | 3.37 |
| Male | 1012 (31.5) | 537 (33.9) | 1549 (32.3) | (0.185) |
| Unstated | 920 (28.7) | 423 (26.7) | 1343 (28.1) | |
| Location of residence | ||||
| Rural | 353 (11.0) | 158 (10.0) | 511 (10.7) | 1.14 |
| Urban | 2856 (89.0) | 1424 (90.0) | 4280 (89.3) | (0.285) |
| Payment method | ||||
| Government subsidy programs | 71 (2.2) | 48 (3.0) | 119 (2.5) | 2.95 |
| Other (i.e., out of pocket, private insurance, unknown) | 3138 (97.8) | 1534 (97.0) | 4672 (97.5) | (0.085) |
| Average annual household income, CAD | ||||
| 40 000–59 999 | 263 (8.2) | 129 (8.1) | 392 (8.2) | 7.74 (0.021) |
| 60 000–99 999 | 2082 (64.9) | 1085 (68.6) | 3167 (66.1) | 1230 (87.3) |
| ≥ 100 000 | 862 (26.8) | 367 (23.2) | 1229 (25.7) | |
| Unknown | 2 (0.1) | 1 (0.1) | 3 (0.1) | |
A second objective of this study was to investigate the association between patients’ sociodemographic status and the provision of urgent dental care during T1 and T2 (Table 2). Specifically, differences in age, sex and income levels were noted when it came to seeking out dental care between T1 and T2, highlighting the disproportionate effect of the COVID-19 pandemic on populations. More older patients sought non-urgent care in T1 than in T2 (p < 0.001). Significantly fewer males and more individuals who did not state their gender sought urgent care at the undergraduate clinic in T1 and T2 (p < 0.001). Significantly, fewer rural residents sought urgent dental care in T1 than in T2 (p < 0.001). Significantly more patients receiving government subsidies attended the clinic for non-urgent procedures during T2 (p = 0.036) than during T1. In addition, significantly fewer patients earning ≥ CAD 100 000 reported to non-urgent care during T2 compared with T1 (p = 0.029).
|
Variable |
Patients, no. (%) |
|||||
|---|---|---|---|---|---|---|
| T1 | T2 | |||||
|
Urgent |
Non-urgent |
Total |
Urgent |
Non-urgent |
Total |
|
|
Note: 1 = Urgent treatment, T1 vs. T2, 2 = Non-urgent treatment, T1 vs. T2, 3 = Urgent vs. non-urgent treatment during T1, 4 = Urgent vs. non-urgent treatment during T2. Bold face p values indicate statistically significant differences. |
||||||
| Age category | ||||||
| 18–29 years | 136 (14.2) | 237 (10.5) | 373 (11.6) | 68 (12.1) | 94 (9.2) | 162 (10.2) |
| 30–60 years | 422 (44.0) | 711 (31.6) | 1133 (35.3) | 232 (41.1) | 407 (40.0) | 639 (40.4) |
| > 60 years | 401 (41.8) | 1302 (57.9) | 1703 (53.1) | 264 (46.8) | 517 (50.8) | 781 (49.4) |
| Χ2 (p) | 3.91 (0.142)1 | 21.87 (0.001)2 | 69.65 (< 0.001)3 | 4.11 (0.128)4 | ||
| Gender | ||||||
| Female | 321 (33.4) | 956 (42.5) | 1277 (39.8) | 208 (36.9) | 414 (40.7) | 622 (39.3) |
| Male | 295 (30.8) | 717 (31.9) | 1012 (31.5) | 182 (32.3) | 355 (34.9) | 537 (33.9) |
| Unstated | 343 (35.8) | 577 (25.6) | 920 (28.7) | 174 (30.8) | 249 (24.4) | 423 (26.8) |
| Χ2 (p) | 3.97 (0.137)1 | 2.87 (0.238)2 | 38.03 (< 0.01)3 | 7.59 (0.022)4 | ||
| Location of residence | ||||||
| Rural | 67 (7.0) | 286 (12.7) | 353 (11.0) | 50 (8.9) | 108 (10.6) | 158 (10.0) |
| Urban | 892 (93.0) | 1964 (87.3) | 2856 (89.0) | 514 (91.1) | 910 (89.4) | 1424 (90.0) |
| Χ2 (p) | 1.77 (0.184)1 | 2.921 (0.087)2 | 22.51 (< 0.001)3 | 1.23 (0.268)4 | ||
| Payment | ||||||
| Government subsidy programs | 20 (2.1) | 51 (2.3) | 71 (2.2) | 12 (2.1) | 36 (3.5) | 48 (3.0) |
| Other (i.e., out of pocket, private insurance, unknown) | 939 (97.9) | 2199 (97.7) | 3138 (97.8) | 552 (97.9) | 982 (96.5) | 1534 (97.0) |
| Χ2 (p) | 0.000 (0.956)1 | 4.36 (0.036)2 | 0.102 (0.749)3 | 2.45 (0.117)4 | ||
| Average annual household income, CAD | ||||||
| 40 000–59 999 | 95 (9.9) | 170 (7.5) | 265 (8.3) | 43 (7.4) | 87 (9.5) | 130 (8.1) |
| 60 000–99 999 | 614 (64.0) | 1468 (65.2) | 2082 (64.9) | 387 (68.6) | 698 (68.6) | 1085 (68.7) |
| ≥ 100 000 | 250 (26.1) | 612 (27.2) | 862 (26.8) | 134 (23.7) | 233 (22.9) | 367 (23.2) |
| Χ2 (p) | 3.93 (0.140)1 | 7.08 (0.029)2 | 4.97 (0.083)3 | 0.494 (0.781)4 | ||
A third objective was to investigate the types and changes in frequency of dental treatments provided between T1 and T2 (Figure 1). Overall, 11 616 procedures were billed in the 2 periods, with more (66.6%) billed for T1. During T2, the category with the highest proportion of billed procedures was urgent care (33.5%), whereas in T1 the highest proportion of procedures (34.3%) were preventative. Higher proportions of services billed in T2 than T1 were in the categories urgent care (33.5%), restorative anterior (9.5%), restorative posterior (21.3%) and prosthodontics (5.1%).
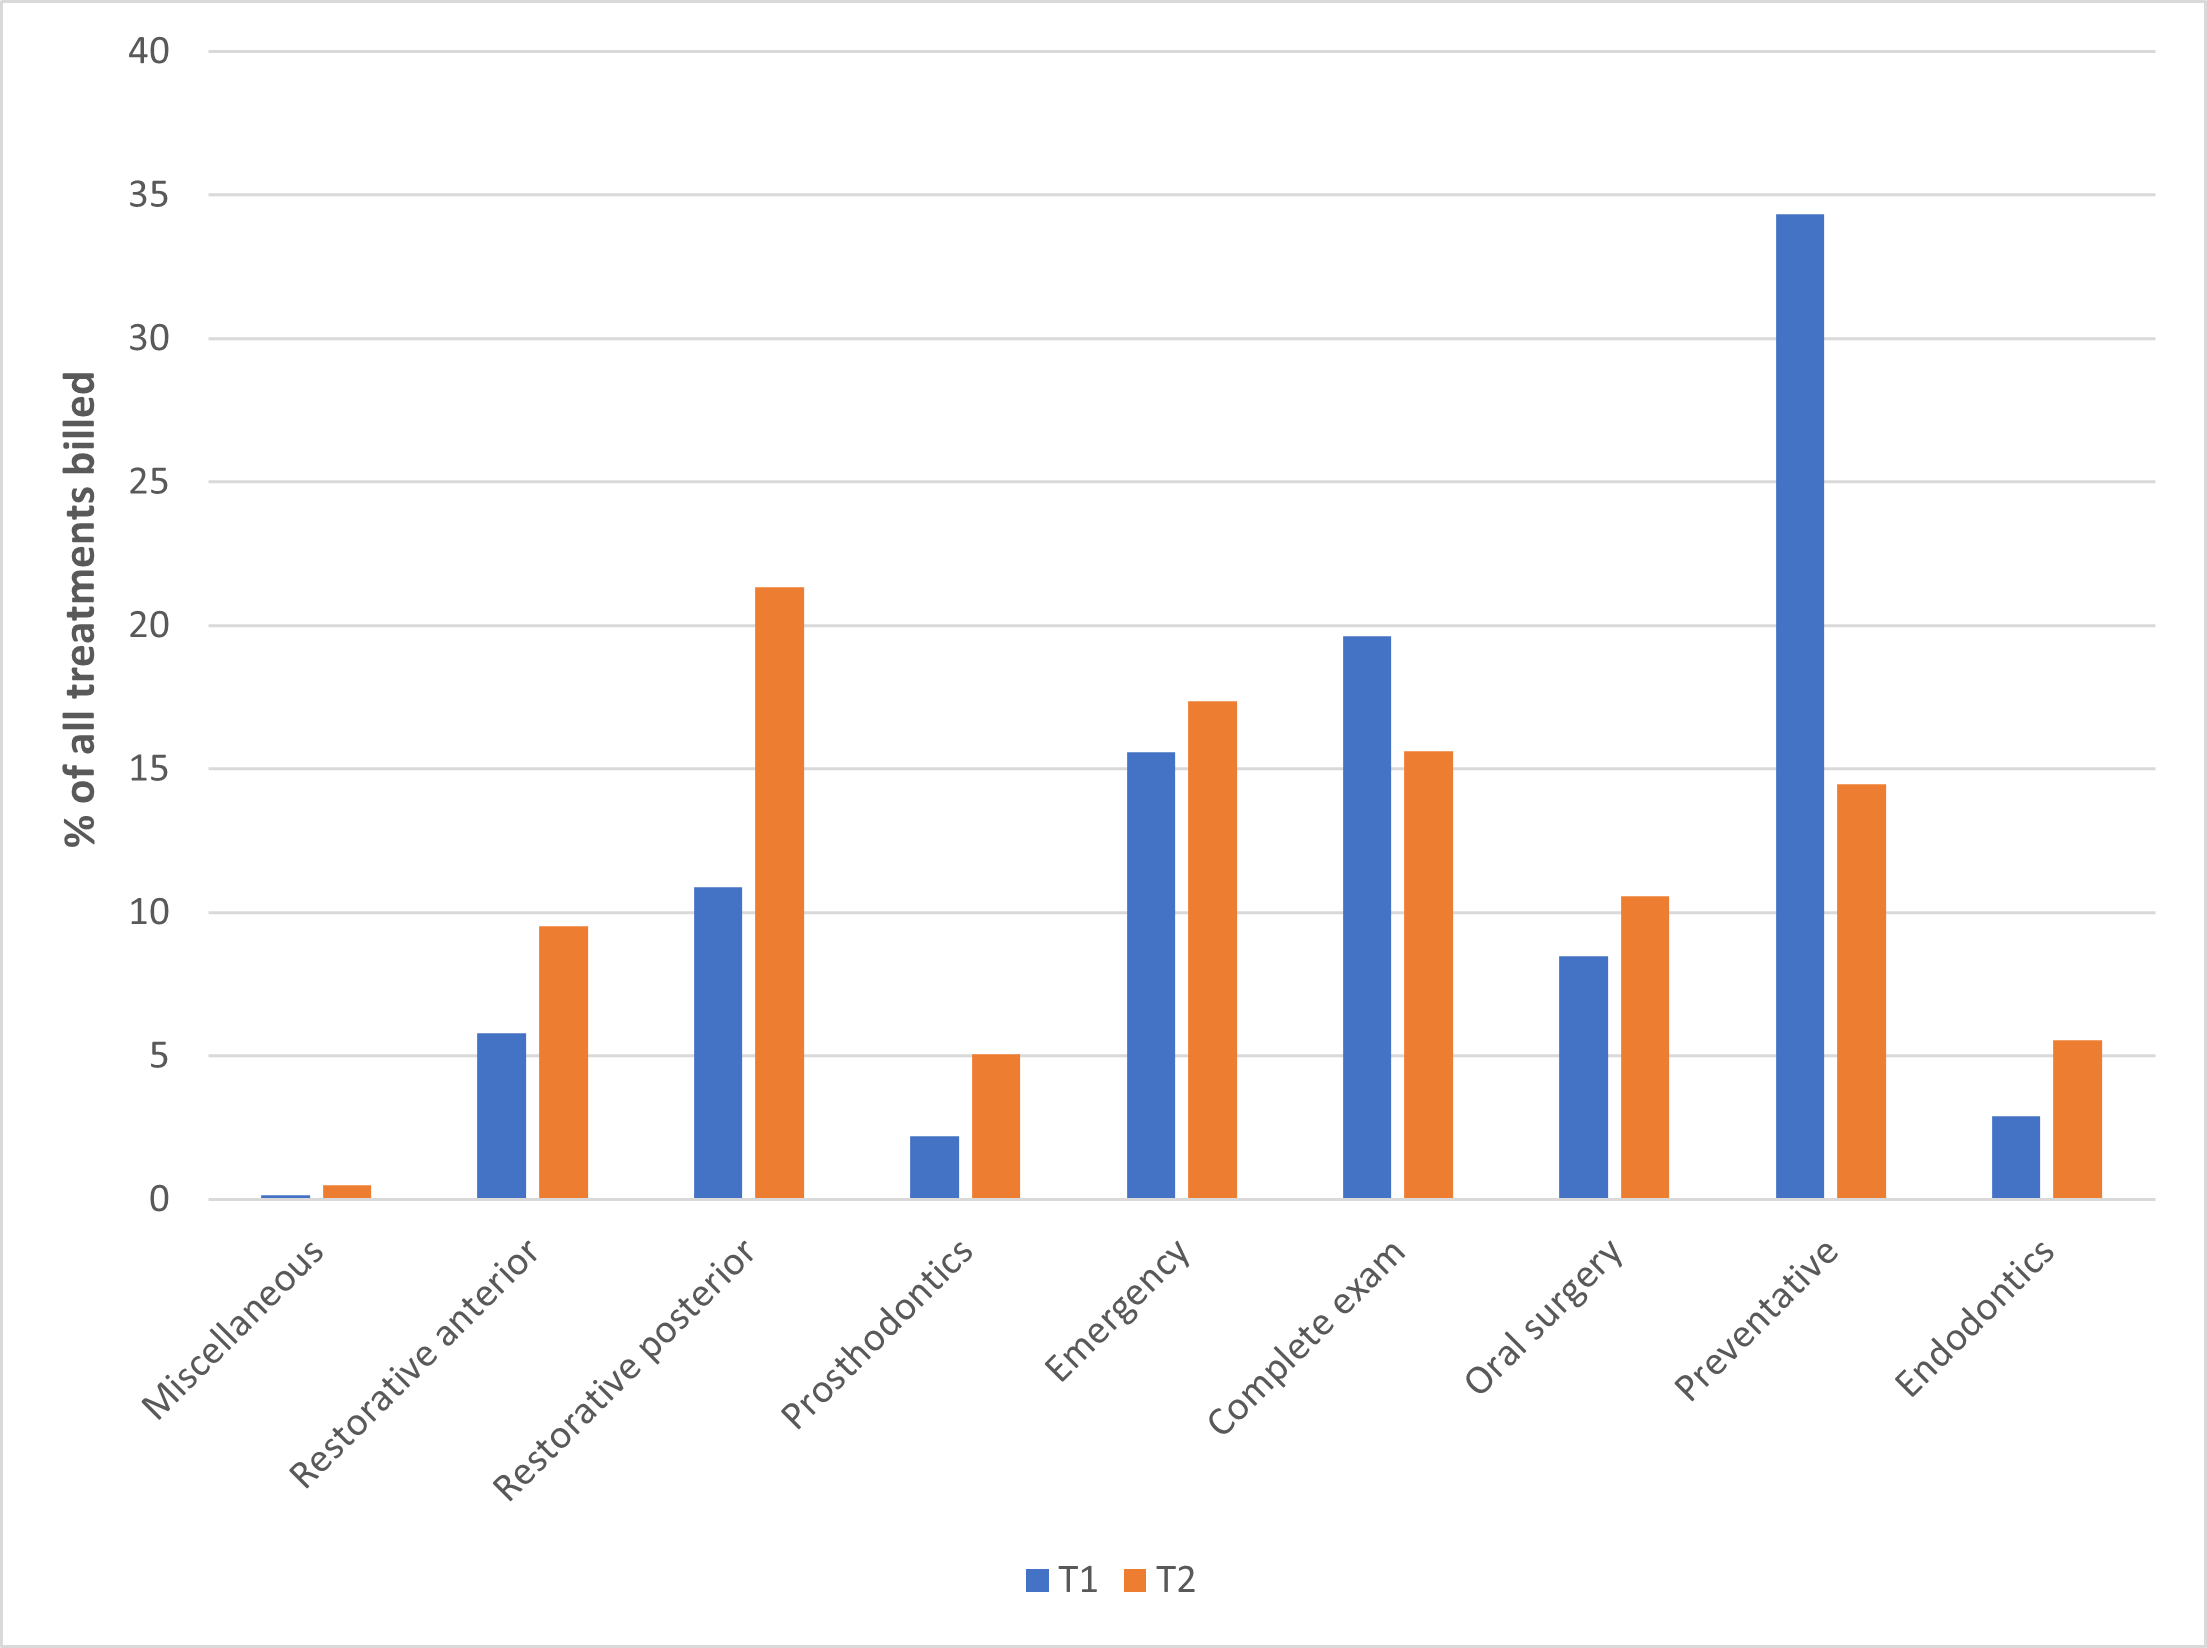
Figure 1: Comparison of treatments completed at an undergraduate dental clinic during a pre-lockdown period (T1, n = 3209) and a post-lockdown period (T2, n = 1582).
Finally, we looked at the geographic distribution of patients during T1 and T2 to determine the influence of transportation and distance on access to care. First, comparing the maps between T1 and T2 show a marked decrease in total counts of patients seen in T2 with a larger portion of the map in T2 being uncoloured. Specifically, the total count of patients coming from the Greater Toronto Area (GTA), which includes Toronto, Peel and York Region public health areas, was reduced in T2 compared with T1. There was also a decrease in total patient counts arising from the Northeast of the province. In T1, the largest patient counts (shown in dark red) came from various areas in the Middlesex-London Health Unit, In T2, the same total patient count came from the central part of the Middlesex-London Health Unit where the undergraduate dental school was located (shown by black dots).
Discussion
This study aimed to investigate the effects of a COVID-19 mandated lockdown on the provision of dental care at an undergraduate dental clinic in southwestern Ontario. Our results align with similar studies showing that the pandemic shifted the sociodemographic characteristics of patients seeking dental care15 as well as the type29,30 and frequency23 of that care.
The number of patients visiting the dental clinic during a 199-day period after lockdown (1582) was a bit less than half the number visiting during a similar period before lockdown (3164), a finding that coincides with other studies.24,30,31 This decline may be attributed to fear among patients regarding the spread of COVID-19 in a dental setting. Ibrahim and colleagues32 reported that more than two-thirds of patients perceived a moderate to high risk of contracting COVID-19 through dental visits; those with a high level of self-reported fear of contracting COVID-19 were 6 times less likely to visit a dentist.33
The decrease in provision of dental care after lockdown can also be attributed to a decrease in clinic chairs and clinical staff available. One of the earliest changes caused by the pandemic was a decline in health care worker a…
