
Abstract
Objective: To improve understanding of how patient-reported outcomes following radiation therapy for head and neck cancer may be influenced by factors beyond the local effects of the radiotherapy.
Methods: Initially, 50 patients with head and neck cancer who were scheduled to undergo radiation therapy consented to participate in this prospective observational study. The participants underwent an oral examination before commencement of therapy and twice weekly over the therapy period. The 33 participants who finished the therapy underwent one more examination 4 to 6 weeks after its completion. At each session, clinical signs of oral mucositis were recorded with clinician-based scoring tools, and participants completed a questionnaire based on a visual analogue scale to record the perceived degree of impairment of common oral functions caused by oral mucositis. The strength of the correlation between these signs and symptoms at various points throughout the study period was appraised using a linear mixed model with robust repeated measures. The study participants with the most extensive manifestations of oral mucositis but only minor pain and limited adverse effects on oral functions (n = 6) were contrasted with those who had limited mucositis but more severe pain and adverse effects (n = 7). In addition, study participants with poor to moderate correlations between signs and symptoms (n = 5) were contrasted with those who had very good correlations (n = 10). Simple bivariate tests were used for these comparisons.
Results: Correlations between various signs and symptoms at all time points varied markedly at the individual level. The characteristics of study participants in the 2 subcohorts defined by poor to moderate and very good correlations between signs and symptoms were comparable, except perhaps in terms of age (p < 0.05, t test). Similarly, the participants in the 2 subcohorts defined by high manifestation with minor complaints and vice versa did not differ with regard to the variables recorded.
Conclusion: Patients with head and neck cancer often report adverse effects of radiation-related oral mucositis on daily oral functions that are discordant with objective clinical findings. Patient-reported outcomes should be included in any interventional studies of oral mucositis, and trends over time should be analyzed within individuals, rather than between individuals.
Patient-reported outcomes and experiences can augment clinical data and may help in assessing the effectiveness of interventions in cancer care.1-4 In cancer clinical research, the use of patient-reported outcomes has been recommended for patients with prostate,5 ovarian,6 gynecologic,7 oesophageal8 or head and neck cancer,9 among other types. Patient reporting can be used to monitor symptoms such as oral pain, skin changes, dental health, dry mouth, taste, saliva quality and quantity, difficulties with swallowing and mouth-opening, shoulder disability or immobility, vocal problems (including hoarseness), social domains and functional domains.9 One symptom that develops during radiotherapy is oral mucositis, which can interfere with cancer treatment,10 lead to weight loss (due to non-intake of food)11 or even prompt cessation of treatment.12 A novel tool known as PROMS (Patient-Reported Oral Mucositis Symptom) addresses the extent to which oral mucositis impairs oral functions, including dysphagia and dysgeusia.13
Many challenges remain in terms of establishing acceptable methodologic approaches to patient-reported outcomes and their optimal implementation in cancer clinical research.14,15 A primary challenge lies in defining the most relevant patient-reported outcomes.16 A second challenge is that the outcomes reported by patients and by clinicians are often incongruous.17 Demonstrating a strong correlation between patient-reported outcomes and relevant clinical outcomes remains important. Equally important, however, is to understand why certain patients differ from the majority in terms of their particular patient-reported outcomes and whether they share some distinctive characteristics. A better understanding of their characteristics will likely lead to improvements in patient care and could also reinforce the justification for including the subjective experiences reported by study participants in prospective clinical cancer research.
In a recent cohort study of patients with head and neck cancer, the authors observed that oral and pharyngeal mucositis of differing severity developed in all participants during the course of the 6- or 7-week treatment period.18 The participants were monitored closely twice weekly throughout the full treatment period by an investigator who used various clinician-based assessment tools in conducting the intraoral examinations and who also collected information by questionnaire. At the group level, the signs of oral mucositis as appraised by the clinician, using a tool of the National Cancer Institute (NCI)19 and the Oral Mucositis Assessment Scale (OMAS),20 correlated well with patient-reported experiences of oral mucositis as appraised by the Patient-Reported Oral Mucositis Symptom (PROMS) tool.13 At the individual level, however, large disparities were recognized in the reported adverse effects on oral functions attributed to oral mucositis. These findings prompted the current investigation to further explore data collected in the course of that earlier study,18 in the hopes of identifying potential explanations for these variations.
The overall objective of these secondary analyses was to determine whether the outcomes reported by patients with head and neck cancer were possibly influenced by factors beyond the local toxic effects of radiotherapy. Potential modifying factors included cancer diagnosis, treatment regimen, age, sex, ethnicity, smoking history, earlier pain experience, mood, coping mechanisms and culture. Two pairs of participant subgroups were contrasted: first, those who reported high PROMS scores but had relatively few clinical findings against those with low PROMS scores and extensive clinical manifestations of oral mucositis; and second, those with poor to moderate correlations between observed signs and patient-reported experience of oral mucositis against those with very good correlations between signs and symptoms.
Methods
Main Study
The methods for this study have been described in detail elsewhere.18 In brief, a prospective single-cohort study was undertaken at the Princess Margaret Cancer Centre, Toronto, Canada. The objective was to appraise the merits of supplementing clinical assessments of oral mucositis with the PROMS instrument for patients with head and neck cancer undergoing radiotherapy with or without concurrent chemotherapy. Study approval was obtained in 2009 from the Research Ethics Board of the University Health Network (reference 09-0231-CE). An a priori power analysis to establish a rank correlation of 0.90 between patient-reported and clinician-observed data yielded a sample group of 20 study participants (a = 0.05% and power of 80%, 2-tailed correlations) (Sample Power software, SPSS Inc., Chicago, IL). In general, dentists recognize that the management of patients with head and neck cancer can be challenging, because of poor oral health behaviours and compliance problems,21,22 and other studies of this patient population have had dropout rates as high as 66%.23 Therefore, in expectation of a high dropout rate, the investigators recruited 50 participants, well beyond the 20 indicated by the power calculation.
For inclusion in this study, participants had to be at least 18 years of age and had to have a diagnosis of carcinoma in the head and neck region, with a minimum Karnofsky performance status score of 60%. All potential participants were scheduled to receive curative radiotherapy for their cancer, with a minimum prescribed radiation dose of 54 Gray (Gy). For some of the participants concurrent chemotherapy was also planned.
The 50 consenting participants underwent an oral examination at baseline before commencement of cancer therapy. Seven participants did not complete their cancer therapy, 3 received less than the minimum 54 Gy dose of radiation, and 7 discontinued participation in the cohort study primarily because of fatigue. The remaining 33 participants were examined clinically twice weekly over their course of radiotherapy (7-week course for 25 patients, 6-week course for 7 patients and 4-week course for 1 patient) and then once more 4 to 6 weeks after completion of the therapy. The most common diagnosis among the 33 participants who completed the whole study was cancer of the oropharynx, T stages 1 and 2 (Table 1).
| T stage*; no. of patients | ||||||
|---|---|---|---|---|---|---|
| Location | Total no. (%) | T0/Tx | T1 | T2 | T3 | T4 |
| *T stage categories are based on the Union for International Cancer Control staging system.24 | ||||||
| Oral cavity | 5 (15) | 1 | 1 | 1 | 1 | 1 |
| Oropharynx | 13 (39) | 1 | 3 | 4 | 3 | 2 |
| Salivary glands | 6 (18) | – | 1 | 2 | 2 | 1 |
| Other | 9 (27) | 4 | – | 2 | 1 | 2 |
| Total | 33 (100) | 6 | 5 | 9 | 7 | 6 |
All study participants received intensity-modulated radiation therapy. The most common dose was fractions of 2 Gy over 33 or 35 visits over 6 or 7 weeks, respectively. The field of radiation and volume of irradiated tissue varied depending on tumour location and TNM cancer stage.24 About half of the study participants received concurrent chemotherapy (n = 15, 45%).
Clinical Examination
Three clinician-based scoring tools were used to record clinical signs of oral mucositis: the clinical component of the NCI Common Terminology Criteria for Adverse Events, version 3 (NCI-CTCAE v. 3),19 the clinical component of the OMAS20 and a tool locally developed in Toronto and termed TOTAL-VAS-OMAS.13 In the NCI-CTCAE v. 3, the occurrence and severity of oral mucositis are graded with an ordinal score ranging between 0 (none) and 4 (most) as observed at any site within the oral cavity. The OMAS concept is based on scoring between 0 (none) and 3 (ulceration) or 2 (erythema) in 9 specific intra-oral locations. Hence, the maximum sum of scores is 27 (9 sites × score of 3) for ulceration and 18 (9 sites × score of 2) for erythema. The TOTAL-VAS-OMAS tool consists of 2 visual analogue scales (VASs) ranging from 0 to 100 mm for full-mouth assessments of erythema and ulceration, respectively. Before the study commenced, the scoring of clinical examiners was calibrated by having them score oral mucositis of various degrees of severity in laminated clinical photographs. These photographs were also used for periodic recalibration during the study period, to prevent “drifting” of intra-rater assessments.
Patient Questionnaire
At every clinical examination, each participant completed a PROMS questionnaire13 to appraise the degree of impairment caused by oral mucositis with regard to common oral functions. The PROMS scale consists of 10 questions, which the patient answers by setting a mark on a horizontal 100-mm line (the VAS). One question focused on mouth pain caused by oral mucositis, ranging from none to worst possible. Another question assessed dysgeusia, ranging from hypogeusia to complete loss of taste. The remaining 8 questions dealt with how much pain was caused by oral mucositis on the day of the clinical examination and its impact on various oral functions, including swallowing.
Statistical Analyses
Main Study
Spearman rank correlation values were determined between the PROMS scale values and, respectively, the NCI-CTCAE v. 3, the OMAS and the TOTAL-VAS-OMAS scores. A linear mixed model with robust repeated measures was used to appraise the strength of correlations at various time points throughout the observation period, taking into account the repeated nature of the measurements. A Bonferroni correction was applied to all statistical tests to account for multiple testing of the same measures. All of the multivariate statistical tests were performed by an independent professional statistician using the statistical procedures PROC CORR and PROC MIXED in the SAS System version 9.2 software (SAS Institute, Cary, NC). Correlations with a Spearman rho of less than 0.20 were considered poor, 0.21–0.40 fair, 0.41–0.60 moderate, 0.61–0.80 good and more than 0.80 very good.25
Secondary Analyses
The characteristics of study participants who had the most extensive manifestations of oral mucositis but reported only minor pain and adverse effects on oral functions (termed “stoical sufferers”; n = 6) were contrasted with those of patients with the most minor manifestations but reporting extensive pain and adverse impact on oral functions (termed “complaining sufferers”; n = 7). In addition, participants with poor to moderate correlations between clinical signs and patient-reported oral mucositis (n = 5) were contrasted with those with very good correlations (n = 10). Because the number of study participants was small in relation to the many identifiable variables, it was considered inappropriate to apply multivariate statistical analyses. Instead, simple bivariate tests were used, i.e., the Fisher exact or chi-squared test for categorical variables and the Student t test for age comparisons in the 4 identified subcohorts.
Results
All participants in this study experienced oral mucositis during the course of radiotherapy, which for some patients manifested as erythema after an absorbed dose of about 6 Gy, increasing thereafter in concert with increased absorption of therapeutic radiation. Some participants reported pain and impairment of oral functions in their first week of radiation treatment. For all patients over all time points, the measured correlations (expressed as Spearman rho) between clinician-determined scores and patients’ experience of oral mucositis ranged between 0.65 and 0.75 (Table 2). The correlations were fairly consistent in the early, middle and late stages of radiotherapy, except for correlations between OMAS ulceration and PROMS scale values at early time points (Table 2). At the individual level, however, Spearman rho values varied markedly, indicating poor to moderate, to very good correlations, as exemplified by study participants “A” and “B” (Figs. 1 and 2, respectively). The characteristics of study participants in the 2 subcohorts defined by poor to moderate and very good correlations were comparable, except perhaps with regard to age (p = 0.038, t test) (Table 3).
Click to enlarge
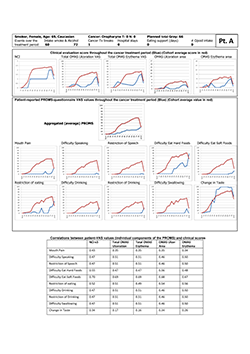
Figure 1: Representative study participant with mostly poor to moderate correlations between clinical signs and self-reported experience of oral mucositis, as represented by individual components of the Patient-Reported Oral Mucositis Symptom tool (Spearman rho 0.16–0.70). NCI and NCI v. 3=National Cancer Institute Common Terminology Criteria for Adverse Events, version 3; OMAS=Oral Mucositis Assessment Scale; PROMS=Patient-Reported Oral Mucositis Symptom tool; Tx=treatment; VAS=visual analogue scale.
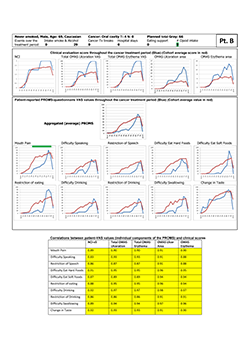
Figure 2: Representative study participant with very good correlations (dark yellow highlighting in tabular element) between clinical signs and self-reported oral mucositis experience, as represented by the individual components of the Patient-Reported Oral Mucositis Symptom tool (Spearman rho.0.83–0.98). NCI and NCI v. 3=National Cancer Institute Common Terminology Criteria for Adverse Events, version 3; OMAS=Oral Mucositis Assessment Scale; Tx=treatment; VAS=visual analogue scale.
| Comparator measure (vs. aggregate PROMS); Spearman rho* | |||||
|---|---|---|---|---|---|
| Cumulative dose of radiotherapy | NCI-CTCAE v. 3 |
TOTAL-VAS-OMAS ulceration | TOTAL-VAS-OMAS erythema | OMAS ulcer area | OMAS erythema area |
| NCI-CTCAE v. 3=National Cancer Institute Common Terminology Criteria for Adverse Events version 3,19 OMAS=Oral Mucositis Assessment Scale,20 PROMS=Patient-Reported Oral Mucositis Symptom, TOTAL-VAS-OMAS=locally developed tool based on visual analogue scale. *Spearman rho < 0.20=poor correlation, 0.21–0.40=fair correlation, 0.41–0.60=moderate correlation, 0.61–0.80=good correlation, > 0.80=very good correlation.25 |
|||||
| < 20 Gy | 0.51 | 0.25 | 0.54 | 0.24 | 0.54 |
| 20–60 Gy | 0.54 | 0.57 | 0.60 | 0.41 | 0.47 |
| > 60 Gy | 0.52 | 0.48 | 0.47 | 0.45 | 0.44 |
| Overall | 0.75 | 0.75 | 0.78 | 0.65 | 0.69 |
| Characteristic | Very good correlation (Spearman rho > 0.80) (n = 10) |
Poor to moderate correlation (Spearman rho ≤ 0.60) (n = 5) |
Remaining participants (n = 18) | Total no. (%) of patients (n=33) |
|---|---|---|---|---|
| SD=standard deviation. *Data missing for one or more patients. †64 and 60 Gy planned for these 2 patients. |
||||
| Sex | ||||
| Men | 9 | 4 | 12 | 25 (76) |
| Women | 1 | 1 | 6 | 8 (24) |
| Ethnicity | ||||
| Caucasian | 8 | 5 | 14 | 27 (82) |
| Other | 2 | 0 | 4 | 6 (18) |
| Age (years) | ||||
| Mean ± SD | 59 ± 8 | 68 ± 6 | 60 ± 12 | 61 ± 9 |
| Range | 49–70 | 62–78 | 39–80 | 39–80 |
| Dental status | ||||
| Good | 4 | 0 | 11 | 15 (45) |
| Fair to poor | 5 | 4 | 7 | 16 (48) |
| Edentulous | 1 | 1 | 0 | 2 (6) |
| Smoking status | * | (n=32)* | ||
| Never | 3 | 0 | 6 | 9 (28) |
| Ex-smoker | 4 | 2 | 10 | 16 (50) |
| Present smoker | 2 | 3 | 2 | 7 (22) |
| Alcohol use | * | * | (n=31)* | |
| No | 3 | 0 | 8 | 11 (35) |
| Yes | 6 | 5 | 9 | 20 (65) |
| Primary tumour location | ||||
| Oral cavity | 3 | 0 | 2 | 5 (15) |
| Oropharynx | 4 | 2 | 7 | 13 (39) |
| Salivary glands | 1 | 1 | 4 | 6 (18) |
| Other | 2 | 2 | 5 | 9 (27) |
| T stage | ||||
| T0 or T1 | 4 | 2 | 5 | 11 (33) |
| T2 | 1 | 1 | 7 | 9 (27) |
| T3 or T4 | 5 | 2 | 6 | 13 (39) |
| N stage | ||||
| N0 or N1 | 5 | 3 | 12 | 20 (61) |
| N2 | 4 | 2 | 6 | 12 (36) |
| N3 | 1 | 0 | 0 | 1 (3) |
| Planned dose of radiation (Gy) | ||||
| 70 | 5 | 3 | 13 | 21 (64) |
| 66 | 3 | 2 | 5 | 10 (30) |
| < 66 | 2 | 0 | 0 | 2 (6)† |
| Planned chemotherapy | ||||
| No | 6 | 4 | 8 | 18 (55) |
| Yes | 4 | 1 | 10 | 15 (45) |
The study participants in the 2 subcohorts defined by high manifestation and minor complaints and vice versa did not differ with regard to variables recorded (Table 4). In particular, the group of “stoical sufferers” (high manifestation, minor complaints) is exemplified by study participant “C” (Fig. 3). This 50-year-old white nonsmoking man experienced maximum clinical scores for oral mucositis yet, except for “difficulties eating hard food” and “change in taste,” values on the PROMS scale were low during the full 6-week treatment period. Moreover, he reported no intake of opioid analgesics. Correlation between individual components of the PROMS tool and the clinician-determined scales was good to very good (Spearman rho 0.70–0.96), except for difficulties with and restriction of drinking and speech.
Study participant “D” (Fig. 4) is presented as an example of a “complaining sufferer.” This 63-year-old white man had only modest manifestations of oral mucositis, yet reported near-maximum scores with the PROMS tool. He also reported high pain levels, despite use of opioids. He was a smoker and continued to smoke during the 6-week treatment period, although the number of cigarettes was reduced to 1 or 2 per day. Correlation between individual components of the PROMS tool and the clinician-determined scales was high (Spearman rho 0.76– 0.98) except for difficulties eating hard foods and change of taste.
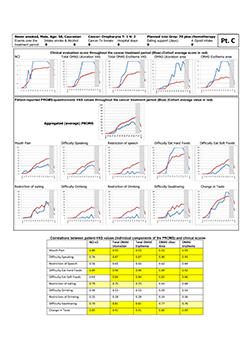
Figure 3: Representative “stoical sufferer,” showing extensive manifestation of oral mucositis but reporting only minor pain and little adverse effect on oral functions. NCI and NCI v. 3=National Cancer Institute Common Terminology Criteria for Adverse Events, version 3; OMAS=Oral Mucositis Assessment Scale; PROMS=Patient-Reported Oral Mucositis Symptom tool; Tx=treatment; VAS=visual analogue scale. In tabular element, dark yellow highlighting indicates very good correlation between clinical signs and self-reported oral mucositis experience (Spearman rho > 0.80), and light yellow highlighting indicates good correlation (Spearman rho 0.61–0.80).
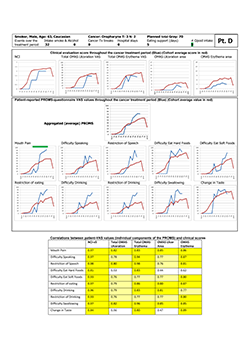
Figure 4: Representative “complaining sufferer,” showing minor manifestation of oral mucositis but reporting extensive pain and adverse impact on oral functions. NCI and NCI v. 3=National Cancer Institute Common Terminology Criteria for Adverse Events, version 3; OMAS=Oral Mucositis Assessment Scale; PROMS=Patient-Reported Oral Mucositis Symptom tool; Tx=treatment; VAS=visual analogue scale. In tabular element, dark yellow highlighting indicates very good correlation between clinical signs and self-reported oral mucositis experience (Spearman rho > 0.80), and light yellow highlighting indicates good correlation (Spearman rho 0.61–0.80).
| Major OM, minor impact (n = 6) | Minor OM, major impact (n = 7) | Remaining participants (n = 20) | Total no. (%) of patients (n=33) |
|
|---|---|---|---|---|
| OM=oral mucositis, SD=standard deviation. *Data missing for one or more… 
| ||||