
ABSTRACT
Objective: This study aims to assess barriers to the use of deep sedation/general anesthesia (DS/GA) identified by dentists in Ontario.
Methods: An email invitation to a web-based survey was distributed to all licensed dentists and specialists who have provided an email address to the provincial regulator (n = 5507). Descriptive and regression analyses were performed to explore practice and demographic factors associated with the use of DS/GA.
Results: The response rate was 18.3%. A quarter (24.8%) of respondents reported inadequate access to DS/GA. Access was poorest in rural communities and greatest in the Greater Toronto Area (GTA). Overall, 74.5% of dentists indicated that they had used DS/GA in the past 12 months. Use was defined as having provided the service or referred a patient in the past 12 months. Non-use was most likely among general dentists, part-time dentists, dentists > 64 years and dentists in urban locations. Wait times and travel distances were reported as longer for medically complex patients. The most common reasons for non-use of DS/GA were a lack of perceived demand and additional costs to patients. For DS/GA users, the greatest barrier was additional costs to patients.
Conclusion: Access to DS/GA in Ontario is not uniform; it remains a challenge in rural communities and regions outside the GTA, especially in the north. Use is lowest among general dentists and urban dentists despite adequate access, with dentists’ perception of need for DS/GA and cost to the patient acting as major barriers. Education for dentists and better insurance coverage for patients may improve access for these patients.
About 12% of Canadians prefer deep sedation/general anesthesia (DS/GA) as an adjunct to their dental care, with an additional 42.3% interested depending on cost.1 Canadian dental patients have indicated a preference for DS/GA for a wide scope of dental treatments, including routine cleaning (7.2%), restorative dentistry (18%), root canal therapy (54.7%), periodontal surgery (68.2%) and tooth extraction (46.5%).1
Dental fear and anxiety are common reasons why patients prefer DS/GA.2 In Canada, 9.8% of adults are somewhat afraid of dental treatment; an additional 5.5% have a high level of dental fear.1 Dental fear is also well established in children, adolescents, teenagers and people with special needs (28%).3 Dental fear or anxiety leads to dental avoidance in both adults4 and children5; fearful/anxious patients are less likely to seek preventative or regular dental treatment, instead presenting for emergency treatment only when needed.3 Of Canadian adults with a high level of fear, 49.2% reported missing or canceling a dental appointment.1
Pediatric dental rehabilitation is the most common reason for children to have ambulatory hospital day surgery in Canada and accounts for 31% of all hospital day cases nationally. From 2010 to 2014, GA was required in hospital for 57 249 children under 6 years of age treated for dental caries (about 12.1 in 1000).6 Total hospital costs were calculated to be $21.18 million annually.6 As this does not take into account dental rehabilitation under GA performed outside the hospital or children currently on wait lists, it likely represents a fraction of the total numbers and cost.6
Access to DS/GA for dental patients in Ontario has not been formally studied or quantified. Evidence suggests that access is suboptimal, with long wait times reported for both adults and children.7 A Canadian report on children receiving dental GA8 states that the use of less costly and more accessible community-based surgicentres could improve access and decrease wait times for this care. Despite minimal research on the barriers to DS/GA care in dentistry, past research indicates many factors (Table 1). Among these, dentists themselves can be a facilitator or barrier to DS/GA, depending on their ability to determine who would benefit from DS/GA and their own personal and professional experience.9 Research in Canada has found that dentists underestimate patients’ desire for sedation or anesthesia.10,11 Therefore, the purpose of this study was to evaluate Ontario dentists’ use of and perceived access and barriers to DS/GA.
| Possible barrier | Reference |
| Additional cost to patients | 1, 19 |
| Lack of third-party insurance coverage | 19 |
| Inadequate coverage by social assistance programs, i.e., Children in Need of Treatment, Healthy Smiles Ontario, Ontario Disability Support Program, Ontario Works | 19, 25, 31 |
| Providing or referring dental anesthesia jeopardizes overall practice profitability | 19 |
| Too time consuming or costly to incorporate anesthesia into practice | 19 |
| High cost or unavailability of malpractice insurance | 19, 31 |
| Sedation and anesthesia do not remunerate well considering their complexity and risk | 36 |
| Unnecessary risk to patients | 19, 36 |
| Lack of patient or parental acceptance of anesthesia | 19, 26, 36 |
| Unnecessary liability or “hassle” in providing anesthesia | 19 |
| Rigorous standards of practice for DS/GA | 19, 33 |
| No available anesthesia provider in my region | 27 |
| Lack of hospital privileges | 34 |
| Wait times are too long for anesthesia appointments | 9, 21, 22, 30 |
| Lack of anesthesia-related continuing education in my region | 17, 19, 28, 36 |
| I did not know anesthesia was available | 38 |
| Difficult to identify which patients would benefit from dental anesthesia | 16, 36 |
| No need in my patient base | 31, 32, 35 |
| Conscious sedation is sufficient and general anesthesia is unnecessary | 19 |
Note: n/a = no comparable data available.
*Source: 2015 registry list of the Royal College of Dental Surgeons of Ontario.
34
†Other refers to periodontists, endodontists, prosthodontists, oral medicine/oral pathologists.
‡Source: Canadian Institute for Health Information.
35
§Source: 2014 Registry of the Ontario Dental Association.
33
¶Source: Baldota and Leake.
36
| Variable | All survey participants, % (n = 954) |
Available Ontario or Canada statistics, % (n = 9158)* |
Effect size (Cramer’s V effect) |
p (χ2 test) |
|---|---|---|---|---|
| PRACTICE CHARACTERISTICS | ||||
| Registration status | n/a | n/a | ||
| Active practice | 98.7 | n/a | ||
| Retired < 12 months ago | 1.3 | n/a | ||
| Field of practice | 0.17 | < 0.001 | ||
| General dentist | 80.6 | 85.8* | ||
| Dental anesthesiologist | 2.8 | 0.4* | ||
| Oral and maxillofacial surgeon | 5.6 | 2.4* | ||
| Pediatric dentist | 4.5 | 1.5* | ||
| Other† | 7.3 | 7.4 | ||
| Hours/week | 0.05 | < 0.001 | ||
| Part-Time (<32 hours/week) | 22.7 | 17‡ | ||
| Full-Time (≥32 hours/week) | 77.3 | 83‡ | ||
| Years of practice | 0.02 | 0.02 | ||
| < 1 | 3.2 | 28§ | ||
| 1–5 | 12.1 | |||
| 6–10 | 9.0 | |||
| > 10 | 75.7 | 72§ | ||
| SOCIAL DEMOGRAPHICS | ||||
| Age of dentist, years | 0.05 | < 0.001 | ||
| < 35 | 13.0 | 14§ | ||
| 35–44 | 19.8 | 24§ | ||
| 45–54 | 26.8 | 26§ | ||
| 55–64 | 27.9 | 22§ | ||
| > 64 | 12.5 | 14§ | ||
| Population at location of primary practice | n/a | n/a | ||
| < 5000 | 4.0 | n/a | ||
| 5000–30 000 | 11.9 | n/a | ||
| 30 001–100 000 | 10.7 | n/a | ||
| 100 001–500 000 | 31.2 | n/a | ||
| > 500 000 | 41.2 | n/a | ||
| Distance to nearest city with pop. > 100 000, km | n/a | n/a | ||
| < 20 | 7.1 | n/a | ||
| 20–50 | 6.4 | n/a | ||
| 51–100 | 6.3 | n/a | ||
| > 100 | 6.4 | n/a | ||
| City classification | 0.04 | < 0.001 | ||
| Rural | 8.5 | 11¶ | ||
| Urban | 91.5 | 89¶ | ||
| Region | 0.11 | < 0.001 | ||
| Northern Ontario | 8.4 | 4.2§ | ||
| Eastern Ontario | 15.0 | 12.0§ | ||
| Central Ontario | 6.6 | 10.2§ | ||
| Southwestern Ontario | 17.5 | 10.4§ | ||
| Hamilton and Niagara | 10.2 | 6.1§ | ||
| Greater Toronto Area | 42.4 | 54.9§ | ||
| Adequate access to DS/GA | 75.2 | n/a | n/a | n/a |
| USE OF DEEP SEDATION/GENERAL ANESTHESIA (DS/GA) | n/a | n/a | ||
| Yes | 74.5 | n/a | ||
| Refers for DS/GA | 55.6 | n/a | ||
| Provides DS/GA | 19.0 | n/a | ||
| No | 25.5 | n/a | ||
Methods
We conducted a cross-sectional web-based survey of practising Ontario dentists (general practitioners and specialists). Ontario dentists were sent emails on behalf of the authors by the provincial regulator (the Royal College of Dental Surgeons of Ontario) and directed by link to an online interface (Survey GizmoTM, Boulder, Col.) displaying the survey instrument. Similar emails were repeated twice in August and September 2014. Dentists, who did not have an office email address, did not practise dentistry, were retired for more than 1 year or had only an academic or student license in the specialties of orthodontics, dental public health or dental radiology were excluded from the study, as they would have limited reason to use DS/GA regularly.
Survey Instrument
We used previously published and validated frameworks on access to health care12,13 to design a theoretical framework for access to dental anesthesia in Ontario (Fig. 1). The key domains of this framework are: (1) the overriding determinant of access is health care policy and health planning, which directly influence (2) the health care delivery system and (3) the end consumers (the patients). The survey instrument was pilot tested among 15 specialists and 15 general dentists in the faculty of dentistry, University of Toronto, to evaluate and validate the design, the burden on the survey respondent (time needed to respond and level of complexity), the response rate, face validity and the feasibility of the planned data analysis. Follow up was completed with the pilot group to ensure that the questionnaire was clear and easy to complete. After revisions, the survey was finalized on the basis of two principal domains:
- Domain 1 included questions based on the measurable factors that influence access to dental anesthesia in Ontario focusing on characteristics of the health care delivery system (e.g., access, use, referral patterns and barriers encountered). Access was defined as having the ability to refer patients for any procedures under DS/GA within a reasonable time and distance. Use was defined as having either referred for or provided DS/GA within the past year.
- Domain 2 included questions that established a dentist’s practice characteristics and social demographic information (e.g., registration status, field of practice, age, years of experience, city population and geographic classification).
Figure 1: A theoretical framework for access to dental anesthesia in Ontario. 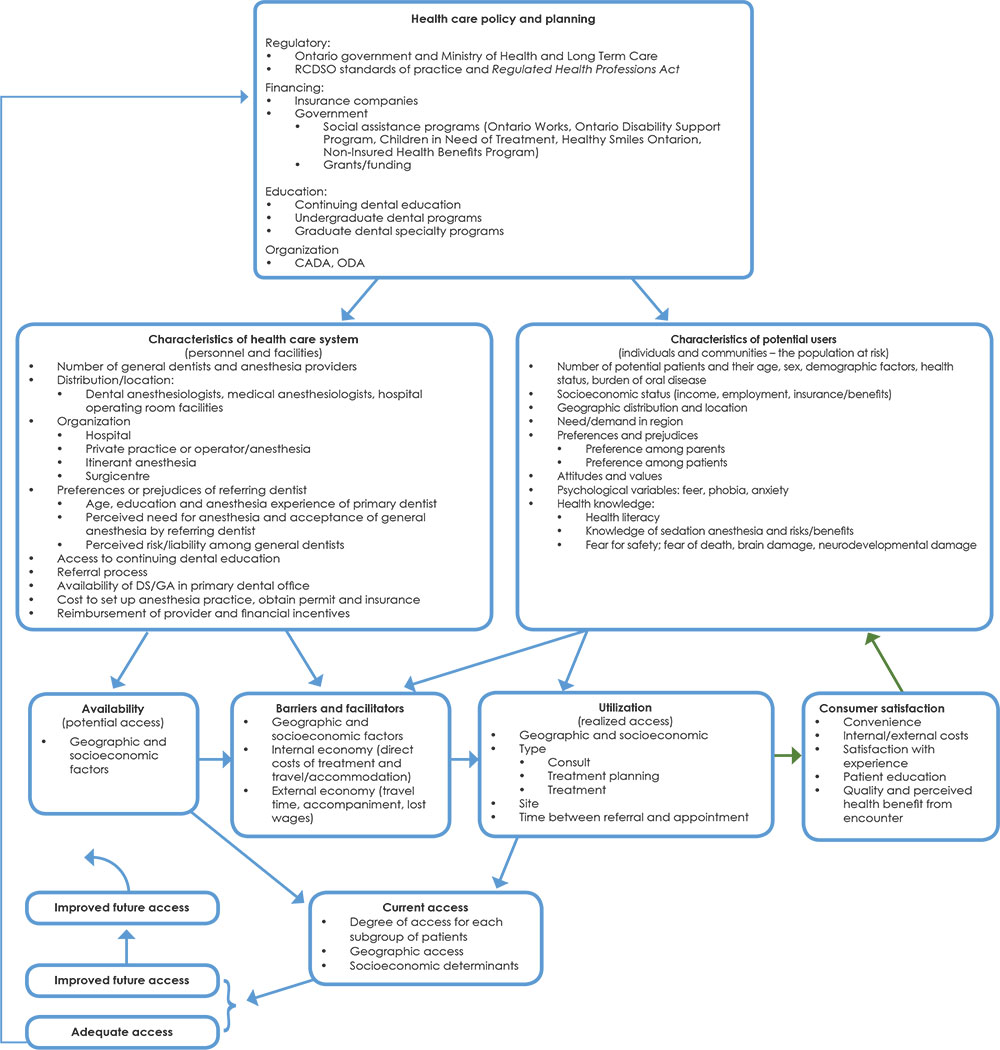
Sample Size Calculation
Based on the total base population of about 8700, an expected response rate of 0.5, a sampling error of 0.05, and a Z-statistic of 1.96, the study sample was calculated to be 951. However, to ensure an adequate number of responses for analysis of the data and to ensure maximum generalizability of the results, the survey was distributed to all Ontario dentists with an available email address14 (Fig. 2).
Figure 2: Sample of Ontario practising dentists responding to web-based survey. 
Data Analysis
The Statistical Package for Social Sciences software v. 22.0 (IBM Corp., Armonk, N.Y.) was used for data analyses. Descriptive analyses of the data were undertaken to summarize the results. The size of Cramer’s V effect was assessed to compare the demographic characteristics of the sample with Ontario-level data. The non-parametric Wilcoxon signed-rank test was used to compare the ranking order of barriers to using DS/GA between DS/GA users and non-users. Logistic regression analyses were conducted to explore factors associated with non-use of, or inadequate access, long waiting time and traveling distance to, DS/GA. All inferential statistical analyses were 2-tailed and interpreted at the 5% level of significance.
Ethics Approval
This survey was approved by the University of Toronto Health Sciences Research Ethics Board (protocol 30192).
Results
Descriptive Results
We achieved a response rate of 18.3% (Fig. 2). Table 2 presents the demographic characteristics of the survey participants. Most respondents were active practising dentists (98.7%), general practitioners (80.2%), 45–64 years old (54%), with more than 10 years of experience (74.3%), practising full time (76.4%) and in urban centres (91.5%) with a population of > 500 000 (41.2%) or 100 000–500 000 (31.2%). Overall, dentists from all regions of Ontario replied, although 41.8% were from the Greater Toronto Area (GTA).
Provision of DS/GA and Referral Patterns
Community- and hospital-based dental clinics were the primary source of DS/GA referral for most medically healthy patients (85.7%) and medically complex patients (59.3%), respectively. Overall, dentists reported that healthy children and adults had to wait less time (only 27.0% and 22.4%, respectively, had to wait > 3 months) and travel shorter distances (only 16.4% and 17.7%, respectively, had to travel > 50 km) than medically compromised patients. In contrast, dentists reported wait times > 3 months for almost half of pediatric and adult medically complex patients (48.3% and 43.5%, respectively). Similarly, travel > 50 km was necessary among 25.7% and 24.5% of these populations, respectively.
Use of and Access to DS/GA
Of the responding dentists, ≥ 75% reported adequate access to and use of DS/GA, i.e., they either referred for DS/GA within the past year (55.6%) or offered the service in their office (19.0%). Access and use by region are mapped in Fig. 3.
Figure 3: Access to (A) and use of (B) deep sedation/general anesthesia by region in Ontario.


Note: Access was reported highest in the GTA (89.4%) and lowest in northern Ontario (34.2%). In contrast, rate of use was reported highest in northern Ontario (82.3%) and lowest in the GTA (69.4%).
Access was reported highest in the GTA (89.4%) and lowest in northern Ontario (34.2%). Access was poorest for dentists in rural towns (odds ratio [OR] 1.9, 95% confidence interval [CI] 1.1–3.2). Compared with dentists in the GTA, those from Hamilton and Niagara (OR 2.9, 95% CI 1.7–5.2), eastern Ontario (OR 2.9, 95% CI 1.7–4.7), central Ontario (OR 3.5, 95% CI 1.9–6.8), southwestern Ontario (OR 3.8, 95% CI 2.4–6.1) and northern Ontario (OR 14.4, 95% CI 7.9–26.1) were more likely to have lower access.
Use was reported highest in northern Ontario (82.3%) and lowest in the GTA (69.4%). DS/GA non-users were most likely to be general dentists (OR 2.1, 95% CI 1.4–3.3); in part-time practice (OR 2.3, 95% CI 1.6–3.3); > 64 years (OR 2.1, 95% CI 1.2–3.8); and practising in an urban centre (OR 2.1, 95% CI 1.0–4.1) (Table 3).
Predictors of Wait Times and Travel Distances for DS/GA
Referral to dental anesthesiologists or oral and maxillofacial surgeons was associated with shorter wait times (OR 2.5, 95% CI 1.8–3.5) but further travel distances (OR 1.7, 95% CI 1.3–2.5), compared with bringing in a traveling anesthesiologist (Table 4). Medically complex patients had higher odds of both longer wait times and travel distances for DS/GA care. Compared with healthy children, medically complex children were twice as likely to experience a wait time > 3 months (OR 2.5, 95% CI 2.0–3.2), as were medically complex adults (OR 2.1, 95% CI 1.7–2.7) (Table 4).
| Variable | Non-use of DS/GA, OR (95% CI) | Inadequate access to DS/GA, OR (95% CI) | ||||||
|---|---|---|---|---|---|---|---|---|
| Unadjusted bivariate | p | Multivariate adjusted | p | Unadjusted bivariate | p | Multivariate adjusted | p | |
| Note: CI = confidence interval, OR = odds ratio. | ||||||||
| PRACTICE CHARACTERISTICS | ||||||||
| Field of practice | ||||||||
| General dentist | 1.79 (1.19–2.69) | 0.005 | 2.1 (1.4–3.3) | 0.001 | Reference | |||
| Specialist | Reference | 1.12 (0.77–1.61) | 0.561 | 1.38 (0.91–2.09) | 0.132 | |||
| Hours/week | ||||||||
| Part time | 2.5 (1.8–3.4) | < 0.001 | 2.3 (1.6–3.3) | < 0.001 | 0.9 (0.6–1.3) | 0.453 | 1.1 (0.7–1.6) | 0.744 |
| Full time | Reference | Reference | ||||||
| Years in practice | ||||||||
| ≤ 10 | 1.0 (0.7–1.5) | 0.818 | Excluded, correlated with age | 1.2 (0.8–1.6) | 0.392 | Excluded, correlated with age | ||
| > 10 | Reference | Reference | ||||||
| SOCIAL DEMOGRAPHICS | ||||||||
| Age, years | ||||||||
| < 35 | Reference | Reference | ||||||
| 35–44 | 1.1 (0.7–1.9) | 0.634 | 1.2 (0.7–2.1) | 0.459 | 0.8 (0.5–1.4) | 0.429 | 0.9 (0.5–1.5) | 0.645 |
| 45–54 | 0.9 (0.5–1.5) | 0.623 | 1.0 (0.6–1.6) | 0.885 | 0.8 (0.5–1.3) | 0.425 | 0.9 (0.5–1.5) | 0.602 |
| 55–64 | 1.1 (0.7–1.9) | 0.619 | 1.2 (0.7–2.0) | 0.516 | 0.7 (0.4–1.1) | 0.108 | 0.6 (0.4–1.1) | 0.097 |
| > 64 | 2.3 (1.3–4.1) | 0.003 | 2.1 (1.2–3.8) | 0.014 | 0.7 (0.4–1.2) | 0.214 | 0.6 (0.3–1.2) | 0.165 |
| Population at location of primary practice | ||||||||
| < 30 000 | Reference | Excluded, correlated urban or rural city classification | 4.2 (2.7–6.4) | < 0.001 | Excluded, correlated urban or rural city classification | |||
| 30 001–100 000 | 1.3 (0.6–2.5) | 0.497 | 2.2 (1.3–3.7) | 0.003 | ||||
| 100 001–500 000 | ||||||||