
Abstract
Objective: The aim of this study was to evaluate the accuracy of 3 thermosensitive microsensors that record “wear time” of removable oral appliances (OAs).
Methods: For in vitro testing, TheraMon (sensor T, n = 20), AIR-AID SLEEP
(sensor A, n = 30) and DentiTrac (sensor D, n = 16) microsensors were placed in a water bath to simulate long and short durations of wear. Their accuracy was also assessed when they were embedded in 3 materials: acrylic, polyvinylchloride and thermoactive acrylic. In vivo testing included 14 volunteers, who wore maxillary retainers embedded with sensors A and D for 30 nights. Logs of appliance use were compared with readouts from the sensors.
Results: In the in vitro long duration of wear assessment, sensor A, with a mean absolute response difference (MARD) of 1.67 min. (SD 1.41), was significantly more accurate than sensor T (MARD 3.53 min., SD 9.80) and sensor D (MARD 4.48 min., SD 8.46). For short duration of wear, sensor A (MARD 1.41 min., SD 3.60) and sensor T (MARD 1.68 min., SD 7.64) were equal in accuracy and significantly better than sensor D (MARD 14.07 min., SD 10.20). The embedding material had no effect on the recording accuracies of the microsensors. In vivo, there was no significant difference between sensors A and D.
Conclusion: All 3 microsensors are highly accurate and reliable and can be used to record wear time of a removable OAs fabricated from various materials.
Successful orthodontic and sleep apnea treatment with removable oral appliances (OAs) is impossible without the cooperation and motivation of patients. Failure to adhere to the prescribed wear schedule may result in little to no response to treatment.1 Although many studies in dentistry and sleep medicine have addressed this issue to determine how to monitor and improve patient compliance,2-14 pinpointing the main determinants of patient adherence is difficult. Investigations of gender, age, psychosocial and socioeconomic variables have found a wide variation among individuals.1,14,15 Evidence also suggests that patients are often selective in which aspect of their treatment they adhere to.16 Thus, predicting which patients will be cooperative is challenging for clinicians. No one variable can be used to predict adherence.
Technology plays an integral role in obtaining objective measures of patient adherence. Many investigators have attempted to use monitors to measure use of devices without subjective judgement,2,4-6,14,15,17-41 with Northcutt introducing the first headgear timer in 1974.6 A small microsensor, embedded in the OA, allows for objective measurement of adherence and incorporation of adherence into an overall comparison of treatment modalities. To our knowledge, 3 thermosensitive microsensors that can be integrated into removable OAs are currently being marketed and initial research studies have been published14,31-36,41,42: TheraMon (IFT Handels und Entwicklungsgesellschaft GmbH, Handelsagentur Gschladt, Hargelsberg, Austria), AIR AID SLEEP (AIR AID GmbH & Co. KG, Frankfurt, Germany) and DentiTrac (Braebon Medical Corporation, Kanata, Canada). However, there are no non-industry-supported studies with a large sample size and statistical analysis to evaluate the accuracy of these monitors.
A well-designed randomized controlled trial to evaluate the effectiveness of OAs requires established metrics to measure adherence. Thus, it is important to examine the accuracy of the recording capabilities of the microsensors to determine whether they can be used for research and clinical purposes. No clinical simulation benchwork has been done to compare these adherence monitors or nor are there studies to determine whether the various materials used in fabricating appliances influence their accuracy. In addition, no studies have assessed the accuracy of these microsensors in vivo, although recent studies34-36,14, 41,43 have used these microsensors to measure adherence. Thus, the objective of this study was to investigate the accuracy of these microsensors to ensure the validity of their use in objectively measuring adherence to treatment with removable OAs.
Methods
Phase 1: In Vitro Testing
In vitro testing was carried out on the AIR AID SLEEP (sensor A), TheraMon (sensor T) and DentiTrac (sensor D). Specifications for these microsensors are detailed in Table 1, and their images are presented in Figure 1.
| AIR AID SLEEP | TheraMon | DentiTrac | |
|---|---|---|---|
| Dimensions, mm | 12 × 8 × 4.5 | 12 × 8 × 4.5 | 10.5 × 8.5 × 4 |
| Weight, g | 0.4 | 0.4 | 0.5 |
| Read out procedure | Radio frequency identification device | Radio frequency identification device | Infrared |
| Temperature range, °C | −25 to 60 | −25 to 60 | 33 to 39.2 |
| “Wear” temperature range, °C | 31.5–38.5 | 31.5–38.5 | 33–39.2 |
| Temperature sensitivity. °C | 0.1 | 0.1 | 0.1 |
| Sampling interval, min. | 5 | 15 | 5 |
| Software | PC | PC | Cloud/PC |
| Storage capacity, days | 100 | 100 | 180 |
| Head position | N/A | N/A | Supine/non-supine |
| Head movement | N/A | N/A | Yes |
| Anti-deception detection | Yes | Yes | Yes |
| Clinical base station | Yes | Yes | Yes |
| Patient reader station | No | No | Yes |
| Download time, min. | ~ 1 | ~ 1 | ~1 |
| Battery life, months | ~ 18 | ~ 18 | ~ 24 |
| Insertion into appliance | Completely embedded in acrylic | Completely embedded in acrylic | Completely embedded in acrylic |
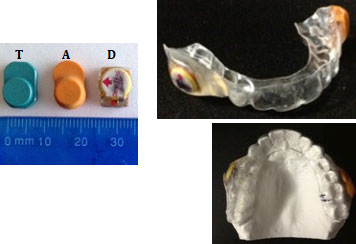
Figure 1: AIR AID SLEEP (A), TheraMon (T) and DentiTrac (D) microsensors and appliance used in phase 2.
Our method was based on the research of Schott and Göz,31 who found that a water bath could be used to replicate the oral environment to test thermosensitive microsensors. Two thermostatic water baths (Digital Water Bath, Whip Mix, Farmington, Kentucky), filled with approximately 1 L of water, were programmed to remain at 35°C. The water baths were preheated for at least 1 h to the desired temperature before inserting the microsensors to ensure that the water was at the desired stable temperature. A log sheet was kept to record when the microsensors were placed in and removed from the water bath. No effort was made to keep the microsensors in the same location or orientation in the water bath throughout the trials.
The long-duration interval trial consisted of maintaining a number of microsensors (sensor T, n = 20; sensor A, n = 30; sensor D, n = 16) in the water bath continuously for 7 h/day for 30 days. This trial aimed to simulate a patient wearing an OA continuously while sleeping.
In a short-duration interval trial, microsensors (sensor T, n = 20; sensor A, n = 30; sensor D, n = 16) were placed in the water bath for 2 h, removed for 1 h and replaced for an additional 2 h each day for 30 days. Thus, the sensors were in water for 4 h and out of water for 20 h each day. This simulates a common daytime wear pattern, in which patients typically wear their appliance and remove it during meals.
In a third trial, sensor T (n = 9), sensor A (n = 9) and sensor D (n = 9) were embedded in 3 different materials, acrylic, polyvinylchloride (PVC) (0.035” thick) and thermoactive acrylic, with 3 of each sensor in each material. Blocks of standard thickness were made by an orthodontic laboratory technician (Space Maintainers Laboratories, Vancouver, British Columbia). The blocks with the embedded sensors were placed in the water bath for a continuous period of 7 h/day for 30 days. The blocks were kept out of the water bath for 17 h each day.
Phase 2: In Vivo Testing
Volunteers (n = 14) were recruited from the student population at the University of British Columbia (UBC), faculty of dentistry. Vacuum formed retainers were fabricated for each participant. One sensor D was attached to the right buccal surface of the retainer and one sensor A to the left buccal surface with acrylic. The appliances were fitted intraorally to ensure accurate fit and comfort. Participants were instructed to wear the appliance at night, while sleeping, for 30 days. They were given a log to record the time, to the minute, when they inserted the appliance at night and removed it in the morning. Data were collected after day 15 to ensure that the sensors were recording and then again after day 30. The appliances were pre-tested and post-tested in a water bath for 7 h for 1 day, to ensure that the sensors were working throughout the in vivo test period. Only data from sensors with accurate pre- and post-test measures were included in the study.37
Ethics Approval
Ethics approval for in vivo testing of the microsensors was granted by the Clinical Research Ethics Board at the University of British Columbia (H12-00855), and all participants signed a consent form.
Statistical Analysis
In phase 1, raw temperature data were exported from the software of the 3 microsensors. For sensors A and T, manufacturers designated temperatures in the range 31.5–38.5°C as representing “wear time”; for sensor D, this range was 33.5–39.2°C. To calculate wear time for each microsensor, the number of temperature recordings within the designated range was multiplied by the sampling interval (i.e., 5 or 15 min., depending on the microsensor type). In phase 2, wear time was obtained from the adherence graphs produced by the microsensors’ software.
Wear time computed from each sensor’s readouts was subtracted from the corresponding participant’s logged time to obtain the difference in minutes.
The results were recorded as mean absolute response difference (MARD) and median absolute deviation. Univariate ANOVA was conducted for each trial in both phases to determine whether there were statistical differences between microsensor types. Post hoc Scheffé multiple mean comparisons were used to determine where the differences occurred. The statistical analyses were conducted using IBM SPSS Statistics 21. The level of significance, α, was set at 0.05.
Results
Phase 1: In Vitro Testing
No technical problems occurred with sensors A and T; therefore, all measurements were included in the statistical analysis for all 3 phase 1 trials. For sensor D, 3 of the 16 sensors were faulty; 1 had a faulty internal calendar and 2 failed prematurely.
In the long duration of wear trial, a large number of deviations were recorded for multiple sensor. As on days 7 and 18. As it is unlikely that all sensors malfunctioned on those days, the deviations must have been the result of assignable error (such as the water bath malfunctioning); therefore, the data for those 2 days were excluded from the analysis. For sensor A, MARD in trial 1 was 1.67 min. (SD 1.41, median absolute deviation 0.00 min.); corresponding results for sensor T were MARD 3.53 min. (SD 9.80, median absolute deviation 0.00 min); and for sensor D, MARD 4.48 min. (SD 8.46, median absolute deviation 5.00 mins, the largest among the 3 sensors) (Table 2). Univariate ANOVA of the results showed a significant difference between the 3 sensors (F = 23.71, df = 2, 1870, p < 0.0001) (Table 3). A Scheffé multiple mean comparison revealed that A < T = D (Fig. 2).
| Trial | Sensor | n | Mean (95% CI) | Median absolute deviation | Maximum | SD | SEM | |
| Note: n = number of observations made by microsensors in trial; CI = confidence interval; SD = standard deviation; SEM = standard error of the mean; PVC = polyvinylchloride. | ||||||||
| Phase 1 – in vitro | ||||||||
| 1 | A | 840 | 1.67 (1.41, 1.94) | 0 | 35 | 1.41 | 0.14 | |
| T | 600 | 3.53 (2.74, 4.31) | 0 | 120 | 9.8 | 0.4 | ||
| D | 431 | 4.48 (3.68, 5.28) | 5 | 175 | 8.46 | 0.41 | ||
| 2 | A | 810 | 1.41 (1.17, 1.66) | 0 | 45 | 3.6 | 0.13 | |
| T | 600 | 1.68 (1.06, 2.29) | 0 | 120 | 7.64 | 0.31 | ||
| D | 430 | 14.07 (13.10, 15.04) | 10 | 40 | 10.2 | 0.49 | ||
| 3 | A | Acrylic | 90 | 0.78 (0.37, 1.19) | 0 | 10 | 1.2 | 0.21 |
| PVC | 90 | 1.22 (0.77, 1.67) | 0 | 5 | 2.16 | 0.23 | ||
| Thermo acrylic | 90 | 0.67 (0.31, 1.02) | 0 | 5 | 1.71 | 0.18 | ||
| T | Acrylic | 90 | 0.67 (0.02, 1.32) | 0 | 15 | 3.11 | 0.33 | |
| PVC | 90 | 3.00 (1.74, 4.26) | 0 | 15 | 6.03 | 0.64 | ||
| Thermo acrylic | 90 | 2.33 (0.23, 4.43) | 0 | 75 | 10.03 | 1.06 | ||
| D | Acrylic | 75 | 3.47 (2.93, 4.00) | 5 | 5 | 2.32 | 0.27 | |
| PVC | 90 | 3.89 (3.45, 4.33) | 5 | 5 | 2.09 | 0.22 | ||
| Thermo acrylic | 90 | 3.83 (3.39, 4.28) | 5 | 5 | 2.13 | 0.22 | ||
| Phase 2 – in vivo | ||||||||
| A | 376 | 6.32 (5.30, 7.34) | 3 | 58.2 | 10.08 | 1.83 | ||
| D | 360 | 6.81 (5.98, 7.65) | 5 | 56 | 8.05 | 0.42 | ||
| Trial | F | df | p | Scheffé multiple mean comparison | |
| Phase 1 – in vitro | |||||
| Note: ns = non-significant. | |||||
| 1 | 23.71 | 21, 870 | < 0.0001* | A < T = D | |
| 2 | 529.02 | 21, 839 | < 0.0001* | A = T < D | |
| 3 | A | 2.03 | 2, 269 | 0.13 | ns |
| T | 2.66 | 2, 269 | 0.07 | ns | |
| D | 0.88 | 2, 254 | 0.41 | ns | |
| Phase 2 – in vivo | |||||
| 0.54 | 17, 35 | 0.45 | ns | ||
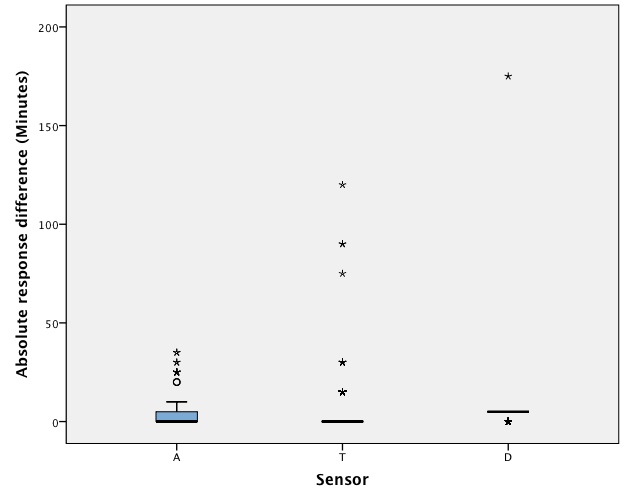
Figure 2: Boxplot of the response differences of AIR AID SLEEP (A), TheraMon (T) and DentiTrac (D) microsensors in trial 1.
In the short duration of wear trial, a large deviation for multiple sensor As occurred on days 1, 2 and 7. These data points were excluded, as the deviations must have been the result of assignable error. In this trial, for sensor A, MARD was 1.41 min. (SD 3.60, median absolute deviation 0.00 min.); for sensor T, MARD was 1.68 min. (SD 7.64, median absolute deviation 0.00 min.); and for sensor D, MARD was 14.07 min. (SD 10.20, median absolute deviation 10.00 min., the largest value). Univariate ANOVA of the results showed a significant difference between the 3 sensors (F = 529.02, df = 2, 1839, p < 0.0001). A Scheffé multiple mean comparison revealed that A = T < D (Fig. 3).
In the third trial, which assessed the effect of various embedding materials on the recording accuracies of the microsensors, there were no significant differences in response for sensor A (p = 0.13), sensor T
(p = 0.07) or sensor D (p = 0.45) as a result of material type: acrylic, PVC or thermoactive acrylic.
Phase 2: In Vivo Testing
Phase 2 participants had a mean age of 27.9 years (SD 2.78). Two participants left the trial prematurely: 1 completed only 23 nights, as she graduated and moved out of town before the trial ended; another completed only 16 nights, as she found the appliance uncomfortable to wear at night. The remaining 12 participants completed the full trial. All 28 microsensors recorded accurate pre- and post-test times. As such, data from all participants’ microsensors were included in the analysis.
In phase 2, sensor A had a MARD of 6.32 min. (SD 10.08, median absolute deviation 3.00 min.), while sensor D had a MARD of 6.81 min. (SD 8.05, median absolute deviation 5.00 min.) (Table 2). Univariate ANOVA showed a statistical difference between microsensor types (F = 6.41, df 13, 383, p < 0.001) (Table 3). A post hoc Scheffé multiple mean comparison revealed that readings for 1 participant, who wore a continuous positive airway pressure (CPAP) device concurrently with the OA, were significantly different from those of other participants; when this person’s readings were excluded, there was no statistical difference between sensors A and D (F = 0.54, df 1, 735, p = 0.45) (Fig. 4).
| Sensor | Phase 1 – in vitro | Phase 2 – in vivo | ||||||||||
| Trial 1 (7 h in + 17 h out)/day |
Trial 2 (2 h in + 1 h out + 2h in)/day |
Trial 3 (material; 7 h in + 17 h out)/day | ||||||||||
| − | 0 | + | − | 0 | + | − | 0 | + | < −10 | −10 to +10 | > +10 | |
| A | 13.2 | 74.4 | 12.4 | 9.5 | 80.9 | 9.6 | 4.4 | 82.6 | 13 | 6.9 | 82.7 | 10.4 |
| T | 10.8 | 81 | 8.2 | 5 | 92.3 | 2.7 | 4.4 | 89.6 | 5.9 | — | — | — |
| D | 0.2 | 18.3 | 81.4 | 20.5 | 10.2 | 69.3 | 0 | 25.1 | 74.9 | 8.1 | 81.8 | 10.2 |
Figure 3: Boxplot of the response differences of AIR AID SLEEP (A), TheraMon (T) and DentiTrac (D) microsensors in trial 2.
Figure 4: Boxplot of the response differences of AIR AID SLEEP (A), TheraMon (T) and DentiTrac (D) microsensors in phase 2.
Overall Analysis
Specificity calculation was used to determine the probability that a test result would be negative when the condition was not present (i.e., out of the hot water bath). The 3 microsensors were highly specific with values of 99.17%, 99.01% and 98.3% for sensors A, T and D, respectively. The index of agreement (R)37,44 between microsensor recordings and logged times was 0.995, 0.996 and 0.976 for sensors A, T and D, respectively. All 3 microsensors were strongly reliable in terms of their recording capabilities.
Response difference data for each sensor in each experimental group were analyzed to identify the frequency of negative, zero and positive deviations. This represents the amount of underestimation, no difference and overestimation of wear time that the microsensors recorded. No deviation was defined as a response difference of 0.00 min. In phase 1, sensor A had no deviation for 74.4–82.6% of the time, sensor T had no deviation for 81.0–92.3% of the time and sensor D had no deviation for 10.2–25.10% of the time (Table 4).
In phase 2, both sensors performed equally well: sensor A responses fell within a 10-min. range 82.72% of the time and sensor D 81.77% of the time. To put the results into perspective, the cumulative log time in phase 2 was 156 313 min. (~2605 h or ~108 days); sensor A showed a cumulative absolute deviation of 2652 min. (~44 h or ~1.8 days) and sensor D showed a cumulative absolute deviation of 2948 min. (~49 h or ~2 days), both of which translate into an overall error of less than 2% (Table 4).
Discussion
This is the first study to present bench testing of 3 thermosensitive microsensors and in vivo testing with quantitative results. Previous studies using sensors A and T have not reported statistical analyses on their reliability32,33,35,36,45; we are not aware of published studies on sensor D, either in vitro or in vivo. With the increased demand for objective adherence monitors, this study increases our understanding of their accuracy, which will support their use in both clinical and research settings. We found that all 3 sensors showed a high degree of accuracy in wear time. The largest response difference was with sensor D, which had a median absolute deviation of 5.00 min. and 10.00 min. for the long- and short-duration trials, respectively. Nevertheless, all 3 sensors were highly accurate and reliable and could be used to record wear time of removable OAs fabricated from various materials.
During phase 1, in vitro testing, the microsensors were placed in a water bath and their computed readouts were compared with time logged by participants. Sensor A was most accurate, followed by sensor T. Sensor D had the largest deviation and was found to overestimate wear most of the time. All 3 sensor types revealed no s…